|
|
VIEWS OF POWER
PLANTS
| 
|
THE
VIEW OF RAM ENGINEERS
RAM:= Reliability,
Availability, Maintainability
Without adequate
RAM analysis, the fundamental technical questions
concerning complex gas/steam power plants cannot
be solved appropriately. RAM studies may be accomplished
in many different ways. The most demanding and
powerful, however, also timeconsuming way is to
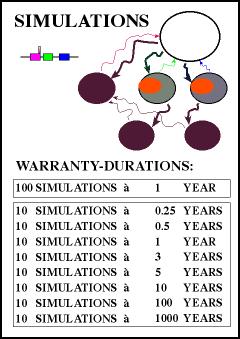
build a model based on simulation tools. Our simulation
model is built and discussed using the Petri-net
approach.
For further
information on the view of RAM Engineers, please
contact View.RAM-Engineers@dendrit.ch
|
 |
|
|
THE
VIEW OF RAM ENGINEERS
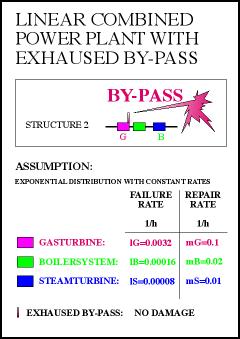
The Petri-net model
as defined by the RAM engineer is nothing
else than another representation of a Marcov
process. The analyzed combined gas/steam
power plant consists of one gas-turbine
(G) with built-in exhaused by-pass, one
steam-turbine (S) and is linked through
one boiler system (B). Every element is
dependent on the other. All assumptions
concerning their failure and repair rates
are shown in the below figures. |
|
|
|
THE
VIEW OF RAM ENGINEERS
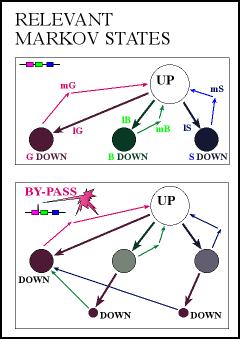
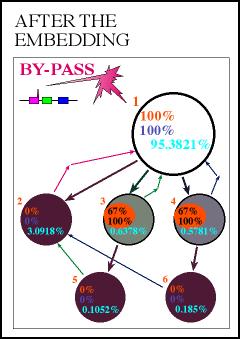
| The RAM engineer knows
that the exhaused by-pass never causes damage.
Moreover, he knows that a system with built-in
exhaused by-pass behaves slightly different
compared to a system without by-pass. The
by-pass has the effect that the total system
observed will not totally break down when
the boiler-system or the steam-turbine falls
out. However, it will fall into a state with
a lower performance level due to not being
linked to the combined effect anymore. Therefore,
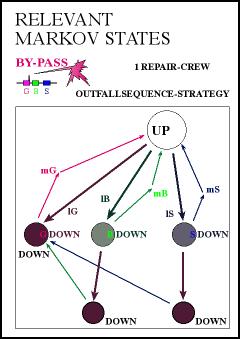
he defines a Markov model that incorporates
the fact that if either the boiler-system
or the steam-turbine breakes down, than the
total system will still produce energy, however,
on a lower level. He assumes for those two
states a performance of 67%. |
|
|
|
THE
VIEW OF RAM ENGINEERS
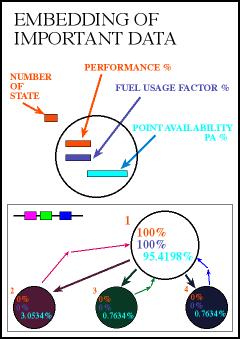
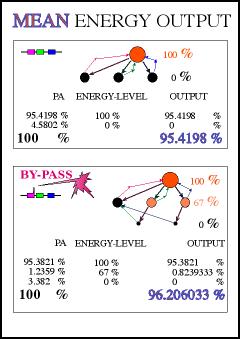
The advantage of
analyzing within the Markov states which
have been finetuned with respect to both
the reliability block diagram and the reality
gets now obvious. On the one hand, it is
possible to define repair strategies by
linking the states differently, on the other
hand, new and important information can
be put into each state. The embeding of
the data is important. Three variables have
been embedded, the performance, the fuel
usage factor and the point availability.
First, the RAM engineer
belives to know that the system will be
repaired by one repair crew (with outfallsequence
strategy). After testing the corresponding
failure-, and repair rates with Kolmogoroff-Smirnow
the RAM engineer finds that the failure
and repair times are well represented by
an exponential distribution with constant
failure-, and constant repair rates.
Second, analyzing
Markov processes enables one to embed those
important figures which are needed to transform
all technical variables into managerial
information. |
|
|
|
THE
VIEW OF RAM ENGINEERS
In this example,
we are only interested in the energy availability
per year. That is why we take the energy
availability of the total system at the
end of each year as the relevant RAM variable.
As a matter of fact, we are not interested
in the point availability, which describes
only the output (stationary state) of an
endless simulation (and which could be calculated
numerically solving differentials). We are
much more interested in a distribution curve
for this very RAM variable. Therefore, it
is not astonishing that we simulate within
the Petri-net.
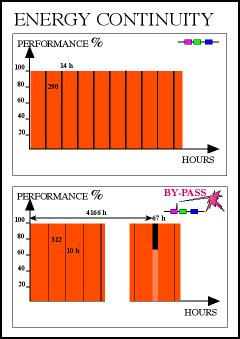
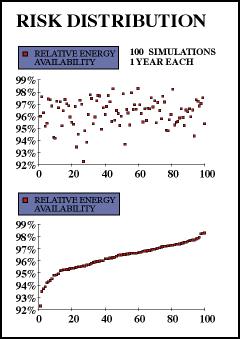
Yearly background
runs enable us to generate such an energy
availability distribution curve. Obviously,
every time when the state is changed, the
related time within the corresponding state
will be multiplied by the state performance.
The result when proceeding as described
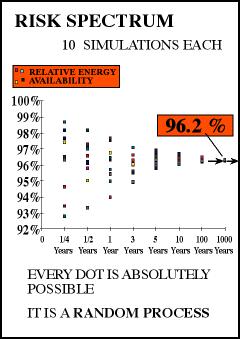
is shown in the below figures. The focus
is put on the simulated distribution with
respect to the RAM variable. The ordered
outputs in the lower graph represent our
RAM distribution curve.
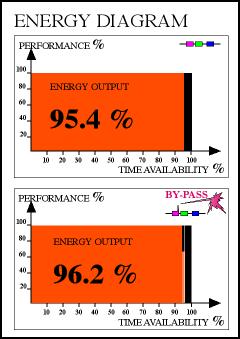
Before finetuning
the model to the technician's view, the
expectation of the energy availability is
96.2%. |
|
|
|
|
|


