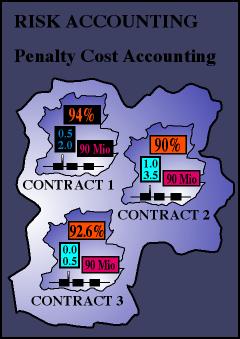
The three contracts
show the following specifications:
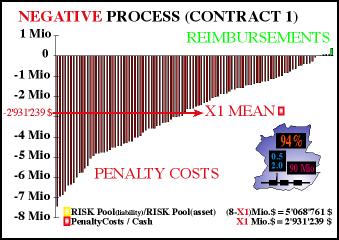
Contract 1:**** Sales
Price: 90 Mio $****Guarantee:
94 %****Penalty
/1% / Refaund /1%: 2 Mio $ / 0.5 Mio $
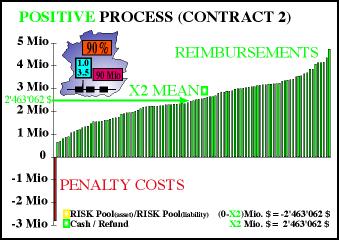
Contract 2:**** Sales
Price: 90 Mio $****Guarantee: 90 %****Penalty
/1% / Refaund /1%: 3.5 Mio $ / 1 Mio $
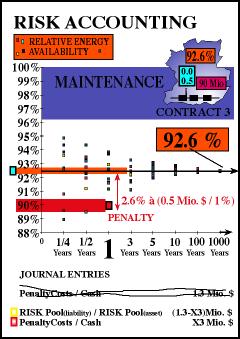
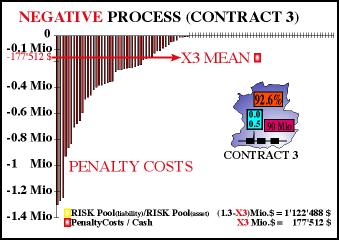
Contract 1:**** Sales
Price: 90 Mio $****Guarantee: 92.6 %****Penalty
/1% / Refaund /1%: 0.5 Mio $ / -
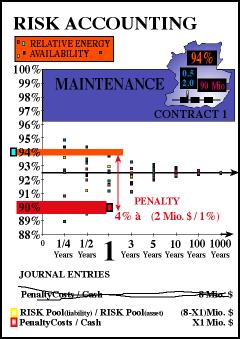
According to contract
1, the buyer and the seller have agreed
upon a guaranteed level of energy availability
at the end of the year of 94%. Furthermore,
a penalty of 2 Mio $ per 1% of lower energy
availability will be charged and must be
paid by the seller. In the case of producing
more than 94% energy availability, a refund
of 0.5 Mio $ will be transferred back from
the buyer to the seller.
The other two contracts
can be interpreted in analogy. Contract
3 is insofar special as there are no refunds
paid at all and both the expectation of
the energy availability and the guaranteed
corresponding figure is the same.
In this example,
the sales price will not be investigated
because it does not influence the yearly
cash flow volatility with respect to our
underlying RAM distribution.
We assume that at
the end of the year all three plants produce
the same amount of energy. Let us further
assume that the observed energy availability
is by random 90%. Remember, that the three
plants are exactly the same as far as their
structure and their failure-, and repair
rates are concerned, thus the underlying
drivers in form of our RAM distribution
curve is exactly the same, too. The only
difference is that the applied financial
contracts between the buyer and the seller
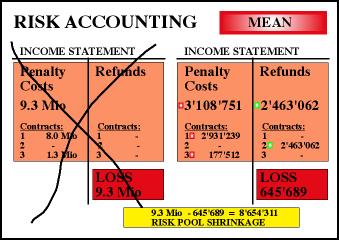
have other specifications. According to
contract 1 a penalty of 4% à 2 Mio
$ = 8 Mio $ has to be paid at the end of
the year. Do we have to punish the seller
of contract 1?
The NOT risk adjusted
journal entry would be: Penalty Costs /
Cash 8 Mio $.
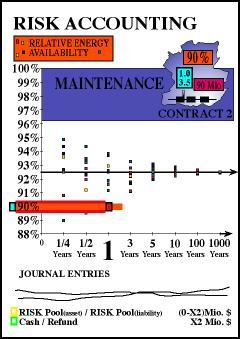
By random, the guaranteed
(set in advance) and the observed (at the
end of the year) energy availability of
the plant 2 (contract 2) are alike. No cash
will flow out of the organization. What
about the salesman of contract 2? Is he
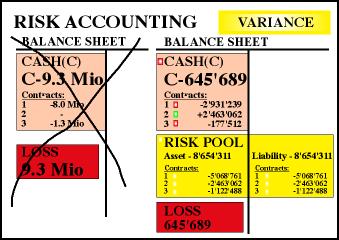
really in a neutral position? In such situations,
a not risk adjusted accounting would not
apply any journal entries. Within a fully
risk adjusted accounting system, we do have
to generate 2 journal entries, one of them
is profit & loss effective, the other
is not. |